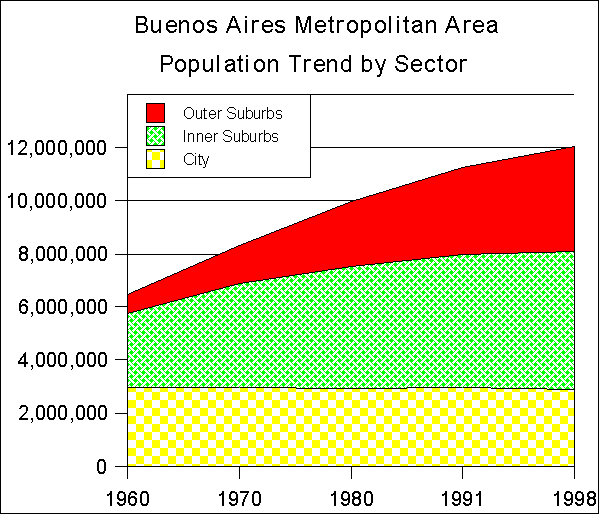
Buenos Aires: Central City &
Suburban Population Trends

|
POPULATION (000) |
|
|
|
|
|
|
|
|
|
|
|
1914 |
1947 |
1960 |
1970 |
1980 |
1991 |
2001 |
|
Central City |
|
1,583 |
2,981 |
2,967 |
2,972 |
2,923 |
2,965 |
2,776 |
|
Inner Ring Suburbs |
|
65 |
1,294 |
2,772 |
3,913 |
4,611 |
5,009 |
5,084 |
|
Outer Ring Suburbs |
|
9 |
539 |
1,184 |
1,910 |
2,996 |
3,989 |
4,837 |
|
Metropolitan Area |
|
1,657 |
4,814 |
6,923 |
8,796 |
10,531 |
11,963 |
12,698 |
|
|
|
|
|
|
|
|
|
|
|
DENSITY (Population per Square Mile) |
|
|
|
|
|
|
|
|
|
Land Area: Square Miles |
1914 |
1947 |
1960 |
1970 |
1980 |
1991 |
2001 |
|
Central City |
77 |
20,514 |
38,634 |
38,448 |
38,523 |
37,880 |
38,432 |
35,979 |
|
Inner Ring Suburbs |
369 |
177 |
3,504 |
7,507 |
10,598 |
12,490 |
13,566 |
13,770 |
|
Outer Ring Suburbs |
2,108 |
4 |
256 |
562 |
906 |
1,421 |
1,892 |
2,294 |
|
Metropolitan Area |
2,555 |
649 |
1,884 |
2,710 |
3,443 |
4,122 |
4,682 |
4,970 |
|
|
|
|
|
|
|
|
|
|
|
DENSITY (Population per Square KM2) |
|
|
|
|
|
|
|
|
|
Land Area: KM2 |
1914 |
1947 |
1960 |
1970 |
1980 |
1991 |
2001 |
|
Central City |
200 |
7,914 |
14,905 |
14,833 |
14,862 |
14,614 |
14,827 |
13,881 |
|
Inner Ring Suburbs |
957 |
68 |
1,352 |
2,896 |
4,089 |
4,819 |
5,234 |
5,312 |
|
Outer Ring Suburbs |
5,465 |
2 |
99 |
217 |
350 |
548 |
730 |
885 |
|
Metropolitan Area |
6,622 |
250 |
727 |
1,045 |
1,328 |
1,590 |
1,806 |
1,917 |
|
|
|
|
|
|
|
|
|
|
|
SHARE OF POPULATION & LAND AREA |
|
|
|
|
|
|
|
|
|
Land Area: KM2 |
1914 |
1947 |
1960 |
1970 |
1980 |
1991 |
2001 |
|
Central City |
3.0% |
95.5% |
61.9% |
42.9% |
33.8% |
27.8% |
24.8% |
21.9% |
|
Inner Ring Suburbs |
14.5% |
3.9% |
26.9% |
40.0% |
44.5% |
43.8% |
41.9% |
40.0% |
|
Outer Ring Suburbs |
82.5% |
0.5% |
11.2% |
17.1% |
21.7% |
28.5% |
33.3% |
38.1% |
|
Metropolitan Area |
100.0% |
100.0% |
100.0% |
100.0% |
100.0% |
100.0% |
100.0% |
100.0% |
|
|
|
|
|
|
|
|
|
|
|
Sources: Calculated from INDEC & www.citypopulation.de information |
|
|
|
|
|
Demographia: Affiliated with The Public Purpose, Twice A National Journal Top Internet Site
Demographia is "pro-choice" with respect to urban development.
People should have the freedom to live and work
where and how they like.
|
(c) 1994-2006 --- www.demographia.com --- Wendell Cox Consultancy --- Permission granted for use with attribution.
|
|


