New York City (Manhattan) Sector
Population Estimates 1800-2000
|
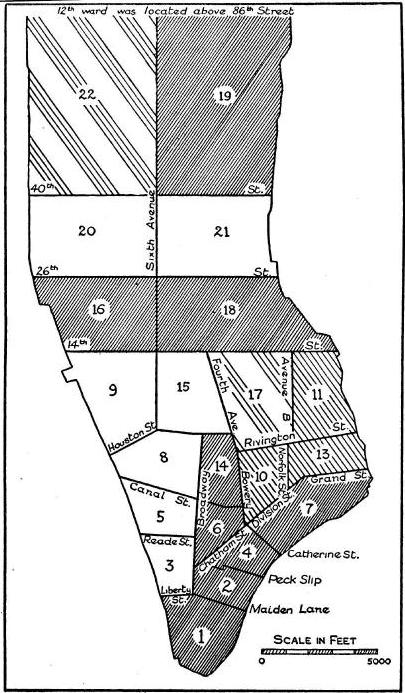
Caution. This page presents an comparative estimate of New York City (Manhattan) population by sector from 1800 to 2000. Sector boundaries are not exactly
the same between 1910 to 1970, with the most significant changes occuring between the North and Central sectors. A statistical adjustment has been made
in an attempt to make the data between these two sectors more comparable for the period from 1880 to 1910.
|
|
In 000 |
Lower East Side |
Lower West Side |
Central |
North |
|
1800 |
15 |
45 |
|
|
|
1810 |
23 |
74 |
|
|
|
1820 |
31 |
91 |
|
|
|
1830 |
60 |
125 |
|
12 |
|
1840 |
106 |
173 |
22 |
12 |
|
1850 |
172 |
230 |
103 |
10 |
|
1860 |
234 |
234 |
309 |
28 |
|
1870 |
279 |
218 |
398 |
47 |
|
1880 |
309 |
233 |
563 |
60 |
|
1890 |
339 |
208 |
794 |
100 |
|
1900 |
455 |
207 |
862 |
325 |
|
1910 |
542 |
226 |
913 |
650 |
|
|
|
Discontinuous. See Note Below |
|
1970 |
182 |
92 |
650 |
608 |
|
1980 |
155 |
103 |
660 |
503 |
|
1990 |
162 |
119 |
684 |
515 |
|
2000 |
164 |
128 |
692 |
545 |
|
|
|
|
|
|
|
Change from 1850 |
(7) |
(103) |
590 |
535 |
|
|
-4.3% |
-44.7% |
573.0% |
5114.7% |
|
|
|
|
|
|
|
Change from 1910 |
(378) |
(99) |
(221) |
(105) |
|
|
-69.7% |
-43.6% |
-8.5% |
-32.4% |
|
Note: 1910 was Manhattan's peak population Census year. |
|
|
|
|
|
|
|
Cautions: |
|
|
|
|
|
In 1970, the North sector contained approximately 20 percent more land area than in 1910 and the Central sector contained approximately 20 percent less land area. Demographia estimate attempts to compensate for this difference between 1880 and 1910. |
|
The Lower East Side and Lower West Side appear to be approximately the same area as in 1910. |


Demographia is Affiliated with The Public Purpose, A Top National Journal Internet Site
Demographia is "pro-choice" with respect to urban development.
People should have the freedom to live and work
where and how they like.
|

