
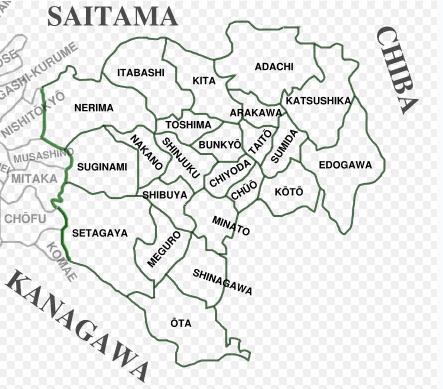
Tokyo Ku Area (Wards):
Population & Density: 1990-2005
(Former City of Tokyo)
|
Ku |
KM2 |
Square Miles |
1990 |
1995 |
2000 |
2005 |
% Change from 1990 |
Population per KM2: 2005 |
Population per Square Mile: 2005 |
|
Adachi-ku |
53.2 |
20.54 |
631,105 |
622,270 |
617,123 |
624,807 |
-1.0% |
11,744 |
30,418 |
|
Arakawa-ku |
10.2 |
3.94 |
184,834 |
176,886 |
180,468 |
191,207 |
3.4% |
18,746 |
48,552 |
|
Bunkyo-ku |
11.31 |
4.37 |
181,361 |
172,474 |
176,017 |
189,632 |
4.6% |
16,767 |
43,426 |
|
Chiyoda-ku |
11.64 |
4.49 |
39,478 |
34,780 |
36,035 |
41,778 |
5.8% |
3,589 |
9,296 |
|
Chuo-ku |
10.15 |
3.92 |
68,076 |
63,923 |
72,526 |
98,399 |
44.5% |
9,694 |
25,109 |
|
Edogawa-ku |
49.76 |
19.21 |
566,200 |
589,414 |
619,953 |
653,944 |
15.5% |
13,142 |
34,038 |
|
Itabashi-ku |
32.17 |
12.42 |
519,203 |
511,415 |
513,575 |
523,083 |
0.7% |
16,260 |
42,113 |
|
Katsushika-ku |
34.79 |
13.43 |
424,903 |
424,478 |
421,519 |
424,878 |
-0.0% |
12,213 |
31,631 |
|
Kita-ku |
20.59 |
7.95 |
354,700 |
334,127 |
326,764 |
330,412 |
-6.8% |
16,047 |
41,562 |
|
Koto-ku |
39.44 |
15.23 |
385,252 |
365,604 |
376,840 |
420,845 |
9.2% |
10,671 |
27,637 |
|
Meguro-ku |
14.7 |
5.68 |
251,136 |
243,100 |
250,140 |
264,064 |
5.1% |
17,964 |
46,526 |
|
Minato-ku |
20.34 |
7.85 |
158,518 |
144,885 |
159,398 |
185,861 |
17.2% |
9,138 |
23,667 |
|
Nakano-ku |
15.59 |
6.02 |
319,688 |
306,581 |
309,526 |
310,627 |
-2.8% |
19,925 |
51,605 |
|
Nerima-ku |
48.16 |
18.59 |
618,430 |
635,746 |
658,132 |
692,339 |
12.0% |
14,376 |
37,233 |
|
Ota-ku |
59.46 |
22.96 |
647,939 |
636,276 |
650,331 |
665,674 |
2.7% |
11,195 |
28,996 |
|
Setagaya-ku |
58.08 |
22.42 |
788,994 |
781,104 |
814,901 |
841,165 |
6.6% |
14,483 |
37,511 |
|
Shibuya-ku |
15.11 |
5.83 |
205,531 |
188,472 |
196,682 |
203,334 |
-1.1% |
13,457 |
34,853 |
|
Shinagawa-ku |
22.72 |
8.77 |
344,679 |
325,377 |
324,608 |
346,357 |
0.5% |
15,245 |
39,483 |
|
Shinjuku-ku |
18.23 |
7.04 |
296,860 |
279,048 |
286,726 |
305,716 |
3.0% |
16,770 |
43,434 |
|
Suginami-ku |
34.02 |
13.14 |
529,572 |
515,803 |
522,103 |
528,587 |
-0.2% |
15,538 |
40,242 |
|
Sumida-ku |
13.75 |
5.31 |
223,041 |
215,681 |
215,979 |
231,173 |
3.6% |
16,813 |
43,545 |
|
Taito-ku |
10.08 |
3.89 |
163,049 |
153,918 |
156,325 |
165,186 |
1.3% |
16,388 |
42,444 |
|
Toshima-ku |
13.01 |
5.02 |
261,970 |
246,252 |
249,017 |
250,585 |
-4.3% |
19,261 |
49,886 |
|
Ku Area |
616.50 |
238.03 |
8,164,517 |
7,967,614 |
8,134,688 |
8,489,653 |
4.0% |
13,771 |
35,666 |
|
|
|
|
|
|
|
|
|
|
|
|
Ku Area |
616.50 |
238.03 |
8,164,517 |
7,967,614 |
8,134,688 |
8,489,653 |
4.0% |
13,771 |
35,666 |
|
|
|
|
|
|
|
|
|
|
|
|
DISTRIBUTION |
|
|
|
|
|
|
|
|
|
|
Yamanote Loop Ku |
157.49 |
60.81 |
2,155,492 |
2,029,115 |
2,087,942 |
2,242,119 |
4.0% |
14,237 |
36,873 |
|
Outside Yamanote Loop |
459.01 |
177.22 |
6,009,025 |
5,938,499 |
6,046,746 |
6,247,534 |
4.0% |
13,611 |
35,252 |
|
|
|
|
|
|
|
|
|
|
|
|
Data from Japan Statistics Bureau and Statistics Center |
|
|
|
|
|
|
|
|
|
|
|
|
|
|
|
|
|
|
Note: City of Tokyo abolished 1943 |
|
|
|
|
|
|
Demographia: Affiliated with The Public Purpose, Twice A National Journal Top Internet Site
Demographia is "pro-choice" with respect to urban development.
People should have the freedom to live and work
where and how they like.
|
(c) 1994-2006 --- www.demographia.com --- Wendell Cox Consultancy --- Permission granted for use with attribution.
|
|