|
|
|
|
|
 Demographia International Housing Affordability (2023 Edition)
Presented by the
Urban Reform Institute and the Frontier Centre for Public Policy
GOVERNMENT LAND USE POLICY: MAJOR SOURCE OF INEQUALITY
The pandemic related demand shock that drove house prices to record heights last year is beginning to moderate. Some housing markets (metropolitan areas) experienced improvements in housing affordability, but most markets remain severely unaffordable with a median multiple (median house price divided by median household income) of 5.1 or more. The least affordable markets are Hong Kong, at 18.8, Sydney at 13.3, Vancouver at 12.0, Honolulu at 11.8, San Jose at 11.5, Los Angeles at 11.3, Auckland at 10.7, Melbourne at 9.9, Toronto at 9.5 and San Diego at 9.4. The most affordable market is Pittsburgh, with a median multiple of 3.1, followed by Rochester at 3.2, with Cleveland and St. Louis, at 3.5. In Under Pressure: The Squeezed Middle-Class, the OECD finds that the middle-class faces ever rising costs of living and that rising owned house prices are the “main driver of rising middle-class expenditure.” Research by Northwestern University economist Mathew Rognlie cites rapidly rising house values as a principal cause of increasing wealth inequality around the world. Where land use policy contributes to deteriorating housing affordability, the resulting increase in inequality should be recognized as an outcome of public policy. Solving the housing affordability problem requires restoration of the competitive market for land in “urban containment markets” and avoiding urban containment where competitive land markets have survived.
Newgeography.com Commentaries
Huffington Post Commentaries
NEW ITEMS | URBAN TOURS BY RENTAL CAR | THE PUBLIC PURPOSE
|
QUICK
INDEX (TABLE OF
CONTENTS) |
INTERNATIONAL
DATA
ISSUES
LAND USE POLICY
& HOUSING AFFORDABILITY
Annual Demographia Int'l Housing
Affordability Survey
Research
Summary: Smart Growth & Housing Costs
Domestic Migration by
Regulatory Category 2000-2008
The Housing Crash and Smart Growth
Housing Affordability & Net Domestic
Migration
Smart Growth's Role in the "Panic of
2008"
Letter: Bank
for International Settlements: Regulation & Risks
How Smart Growth Exacerbated the Intl Finl
Crisis: Heritage
US Housing Affordability
Indicators by Ethnicity
Smart Growth & Housing
Affordability: 8 Market Analsis
Housing Downturn in the US:
Update 2009q1
The Panic of 2008: How Bad is It?
Household Residence & Stock Value from
1925
Don't Regulate Suburbs: Heritage
Foundation
Causes of the Financial Crisis:
Primer
House Price
Increases & Subprime Mortgage Share
Smart Growth Bailout: The Mortgage
Meltdown
Costs of Sprawl 2000: Erroneous
Forecast
Smart Growth and Housing
Affordability
OECD: Connects Land Use
Regulation with High Prices
2008 Price Change by 2007
Median House Price
Home Ownership & Democratizing
Prosperity
USA HUD: Smarth Growth
Hurting Affordability
The NIMBY Report: A Decade
Later: Dr. Ronald D. Utt
Overselling Local Street Grids
Domestic
Migration & Housting Affordability
USA Housing
Starts per 1,000 Households: 1920-
USA
Metropolitan Areas: 1971 Median House Prices
Housing Crisis Moves into Phase II
The Smart Growth Bail-Out
Housing Bubble: Learning from
California
Obama's Friends: Enemies of the American
Dream?
House Prices to Fall Further: Especially
in California
China Should Send Western Urban Planners
Home
Houses, Castles & the Universal
Dream
American Dream Alive & Well in Some
Places
How Low can House Prices Go?
Distribution of House Price Declines:
California
America: More Small Town than We
Think
SUBURBANIZATION
& URBAN POLICY
Costs of
Sprawl Reconsidered: What the Data Really Show
How Smart Growth Exacerbated the Intl Finl
Crisis: Heritage
Costs of Sprawl Measured in
Benefits
Smart Growth
& Housing Affordability: 8 Market Analsis
How the Suburbs Made Us
Rich
The Auto, Economic Growth & Poverty
Reduction
Brief: Smart
Growth
Traffic & Density: International Urban
Areas
Traffic & Density: US Urban
Areas
Growth
Management & Infrastructure Costs: California
China Should Send Western Urban Planners
Home
Europeans are Moving to the Suburbs
Louvre Cafe Syndrome: Getting Europe
Urbanization Wrong
Shorter Commutes in New York
Suburbs
Smart Growth Victimizes
African-Americans
Urban Planning in the
Decline of American Cities
Lower Urban Density Associated
with Higher Income
Happenstance & Artifacts:
The Rusk City Elasticity Theory
Mythical Underpinnings of Smart
Growth
Planning is a Tool, Not a Goal
Property, Prosperity &
Poverty: IEA London Lecture
Myths About Smart Growth and
the Toronto Greenbelt
Places Worth Caring About
PA Township Government: More Effective,
Less Costly
Land Use: Largest California
Metropolitan Areas
America: More Small Town than We
Think
GREENHOUSE GAS
EMISSIONS
Regulating Greenhouse Gases Not
People: Heritage
Regulate GHGs .. Not People
How to Grapple with Greenhouse
Gases
GHGS & Housing Form in
Australia
Greenhouse Gas Policy: Separating Rhetoric
from Reason
GHGS & Housing Form in
Australia
Australia: GHG Emissions by
Urban Transport Mode
United Kingdom: GHG
Emissions by Urban Transport Mode
The Auto, Economic Growth & Poverty
Reduction<
USA: GHG Emissions by Urban
Transport Mode
USA: GHG Emissions by Intercity
Transport Mode
Full Accounting of Transport GHG
Emissions
Counterproductive GHG Policy in
California
AGRICULTURE
Agriculture Index
Australia Agricultural Land:
1981-2005
Japan Agricultural Land: 1975-2000
EU-15 Agricultural Land: 1961-2001
Canada Agricultural Land
United States Urban & Agricultural
Land: 1950-2000
United States Agricultural Land:
1950-2000
Agriculture
Index
Agricultural
Land & Values US Metropolitan Area
Agricultural
Land & Values 2002 & 2007 by US Geog Sector
Agricultural
Land: 2002 & 2007: States: USA
|
LOCAL DEMOCRACY
& CONSOLIDATION
Consolidation Report for City of
Toronto
Toronto Megacity: Costly Community
Destruction
Local Democracy in Ohio: Efficiency by Size
PA Township Government: More Effective,
Less Costly
Government Efficiency: New York
Report
Separating Rhetoric from Reality:
Townships in Indiana
Local Democracy in
Illinois
Local Democracy in
Chicagoland
Higher Costs of Rationing Local Govt:
Michigan Report
Cover Story: PA Township Report
Montreal Suburbs Vote to Secede
Are Bigger Governments Better?
Failure of the Toronto Megacity: National
Post Oped
USA Local
Governments by Population: 2000
Montreal Demerger: National
Post Oped
America: More Small Town than We
Think
ECONOMICS
How Smart Growth Exacerbated the Intl Finl
Crisis: Heritage
The
Auto, Economic Growth & Poverty Reduction
USA Personal
Income per Capita 1929-2008
How Smart Growth Exacerbated
the Intl Finl Crisis: Report
Research Summary: Smart Growth
& Housing Costs
US Housing Recession: Phase 1
& 2 Analysis
Household Residence & Stock Value from
1925)
USA Housing
Starts per 1,000 Households: 1920-
House Price
Increases & Subprime Mortgage Share
Smart Growth Bailout: The Mortgage
Meltdown
Costs of Sprawl 2000: Erroneous
Forecast
China City per Capita Income:
September 2005
Regional GDP: Europe, N.
America, Japan, Oceana
Brazil: Gross Domestic Product
(GDP/PIB) by State: 2000
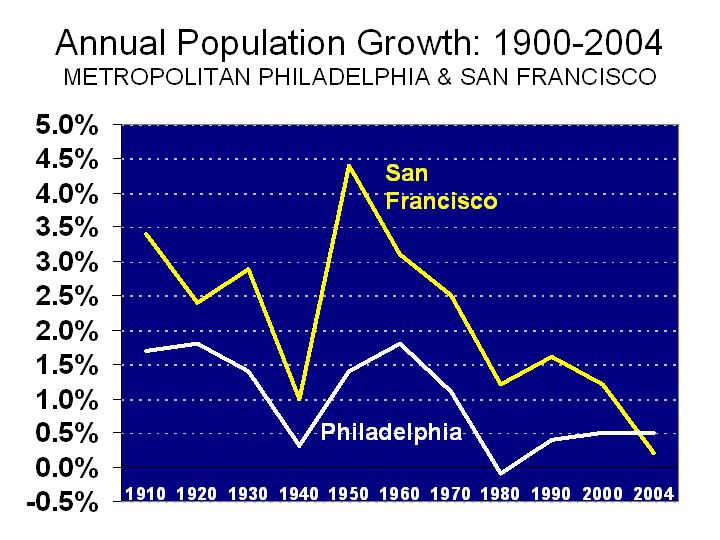
US Trade Union Market Share
1900-2004
Property,
Prosperity & Poverty: IEA London Lecture
HIGH SPEED RAIL
XpressWest
High Speed Rail: Default Seems Likely
DesertXpress
High Speed Rail: Default Seems Likely
Las Vegas
High Speed Rail: Default Seems Likely
High Speed Rail Taxpayer Risk Assessment
VIDEO
Tampa to Orlando High Speed Rail Risk
Assessment
California High Speed Rail: A Due
Diligence Report
California High Speed Rail: An Updated Due
Diligence Report
California High
Speed Rail: Dynamic GHG Cost Analysis
Florida High Speed Rail Evaluation
Report
Playing With Trains
(NewGeography.com)
FREIGHT TRANSPORT
Europe (EU-27) & USA
Freight GHGs
Freight Rail's Potential to Alleviate
Traffic Congestion
Solving the Freight Rail Transportation
Bottleneck
URBAN
TRANSPORT
The Public Purpose Website
Urban Transport Fact Book
The Auto, Economic Growth & Poverty
Reduction
US Transit Journey
to Work Share: 1980 & 2008
Induced Traffic: Setting the Record
Straight
Median Income by Commuting Mode:
USA
Improving the Quality of Life through
Telecommuting
London Congestion Charge Cautions:
Commentary
Demographia USA Journey to Work Data
2007
USA Subsidies/Passenger Mile from
1960
New York:
Employment & Commuting: 2006
USA Urban Transport Market Share from
1900-
USA Urban areas Transit Market Share 2008,
1983
The Dimensions of Sustainability: W.Cox
and J.C.Ziv
US Mass Transit Value for Dollar:
1970-2006
Summary of Highway and Mass Transit
Finance: USA: 2006
US Consumer Expenditures:
Transport & Housing 2007
USA Urban Area Density & Intensity of
Traffic
Freeway Access: USA, Canada,
Australia & New Zealand
Freeway Access: High-Income
World Urban Areas
US Journey to Work Data: 2000
Higher Density Intensifies Traffic
Congestion & Air Pollution
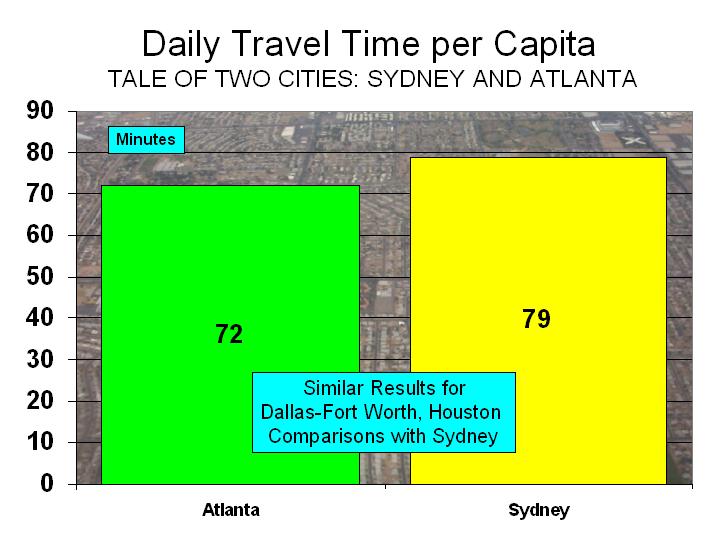
Travel Time Less in Atlanta
than Sydney
Blueprint 2030: Better Transportation for
Atlanta
Apple Daily Oped on Hong Kong Rail
Expansion
Public Transport in the USA: Value per New
$
Highway User Fees Spent on Transit &
Highways
The
Realistic Limits of Public Transport
USA Urban Transport Statistics: A
Compendium
Costs of Driving & Public Transport
from 1960
Top USA
Downtowns: USA: Jobs & Public Transport
Europe Work Trip Times: City &
Suburbs
Light Rail & Freeway Lane Passenger
Use per Kilometers
Delhi Metro Rider Subsidy Exceeds
GDP/Capita
The American Gridlock Myth: Letter to the
Daily Telegraph
Estimated Diversion of
Roadway Traffic to Transit
Australia: Urban Automobile Use
Trend
Australia: Core Employment & Transport
Share
Western
Europe Public Transport Market Shares
Megacities and Affluence: Transport &
Land Use
USA Urban Transport Market Share from
1900
USA Urban Transport Market Share: Top 50
Urban Areas
USA: Largest Downtowns:
Employment & Work Trip Travel
Shorter Commutes in New York
Suburbs
|
NATIONAL
DATA
METROPOLITAN AREA &
URBAN AREA DATA
ADELAIDE
Central Business District: Employment
& Commuting
ATLANTA
Atlanta
Index
Smart Growth
& Housing Affordability: 8 Market Analsis
American
Dream Boundaries: Atlanta v. Portland
Arterial street system needed (AJC
oped)
Atlanta
Metropolitan Growth by Sector: 1960-2004
Atlanta
& Boston: Similar Surburban Forms
Travel Time Less in Atlanta
than Sydney
Atlanta, DFW, Houston: Fastest
Growing, Most Sprawling
Blueprint 2030: Better Transportation for
Atlanta
Rental Car Tour: Atlantic Station
AUSTIN
Zero Sum
Game: The Streetcar
BEIJING
Beijing
Index
Beijing: District Population
& Density
Biejing: Rental Car Tour
BOSTON
Smart Growth & Housing
Affordability: 8 Market Analsis
Boston Urbanized Area
Population & Density from 1920
Atlanta
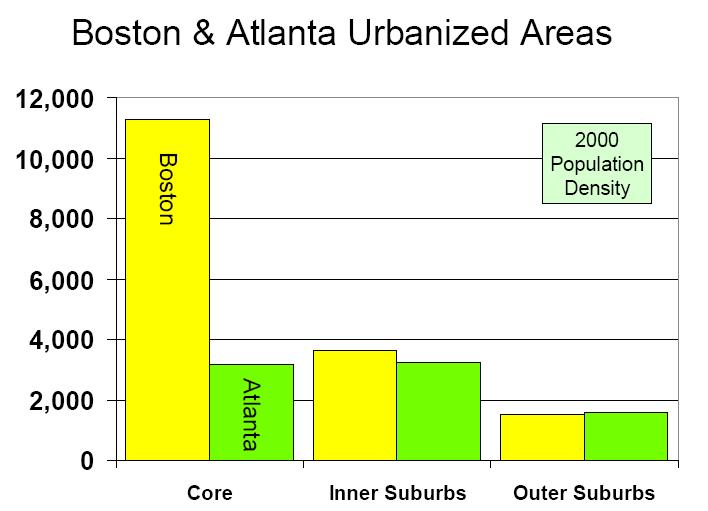
& Boston: Similar Surburban Forms
Boston:
Rental Car Tour
BRISBANE
Central Business
District: Employment & Commuting
BUENOS
AIRES
Buenos Aires Index
Buenos Aires
Population History
Buenos Aires: Core &
Suburban Population Trend
Buenos Aires: Rental Car
Tour
CAIRO
Cairo Urban Area: Core &
Suburban Population
Cairo: Rental Car Tour
CHENGDU
Chengdu: Rental Car Tour
CHICAGO
Chicago
Index
Chicago
Districts: Population & Density: 1980-
CINCINNATI
Urban
Population & Density: 1900
Cincinnati: Rental Car
Tour
DALLAS-FORT WORTH
Smart Growth & Housing
Affordability: 8 Market Analsis
Transit Ridership Stagnant with More Light
Rail
DELHI
Delhi: Rental Car Tour
DONGGUAN: SEE PEARL RIVER
DELTA
GUANGZHOU: SEE
PEARL RIVER DELTA
HONG KONG: SEE
PEARL RIVER DELTA
HOUSTON
Post
Hurricane Katrina Population Estimate
Houston:
Rental Car Tour
Debunking the Houston Drives
Most Myth
Urbanization
in Houston Metropolitan Area
INDIANAPOLIS
Smart Growth & Housing
Affordability: 8 Market Analsis
ISTANBUL
Istanbul: Rental Car Tour
JAKARTA
(JABOTABEK)
Jabotabek: Rental Car Tour
Jakarta: Rental Car Tour
KANSAS
CITY
Smart Growth
& Housing Affordability: 8 Market Analsis
KOLKATA
(CALCUTTA)
Kolkata: Rental Car Tour
KUALA
LUMPUR
Kuala Lumpur: Rental Car Tour
LAS
VEGAS
Las Vegas Land Market
Analysis
Las Vegas: Rental Car Tour
Las Vegas Monorail Analysis: 2000
LONDON
London Index
Southeast
England Population from 1891
London Urban Area Population
& Density from 1680
London Area: Jobs-Housing
Balance Planning Failure
London: What if There Had Been
No Greenbelt?
London Boroughs 1951-
London
Central Area Employment from 1997
London: Population &
Density History
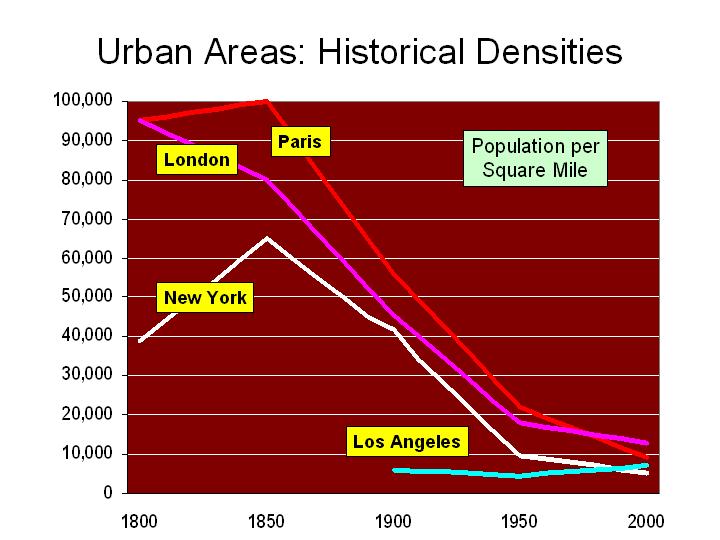
Historical Densities: New York,
London, Paris, Los Angeles
Density Profile: Hong
Kong, Tokyo & New York
London: Rental Car
Tour
LOS
ANGELES
Los Angeles
Index
Los Angeles
Most Dense North American Urban Area
Los Angeles
Double Portland Density
City of Los Angeles: Population
by Area from 1950
Historical Densities: New York,
London, Paris, Los Angeles
Los Angeles: Rental Car Tour
MACAO: SEE PEARL RIVER
DELTA
MADRID
Madrid: Rental Car Tour
MANILA
Manila: Rental Car Tour
MELBOURNE
Central Business District: Employment
& Commuting
MEXICO CITY
Mexico City Index
Mexico City
Population Trends by Sector from 1960
Mexico
City: Rental Car Tour
Mexico City #2: Rental Car Tour
#2
MINNEAPOLIS-ST.PAUL
Minneapolis-St. Paul
Index
MSP
Metropolitan Area Population Trends 2000-2004
Planning for
Yesterday in the Twin Cities
MONTREAL
Montreal: Competitive Due to
Suburbanization & Cars
Montreal: Rental Car Tour
MOSCOW
Moscow: Rental Car Tour
MUMBAI
Mumbai
Index
Mumbai
Population Trends: City & Suburb 1981-
Mumbai: Rental Car Tour
MUNICH
Munich
Region: Change in Commuting: 1998-2006
NAGOYA
Nagoya
Index
Nagoya:
Rental Car Tour
Nagoya Wards Population &
Density 1990-2000
Nagoya Business Districts:
2001
Nagoya: Transport Share by Mode
House Size, Ownership
& Detached Housing 2003
NEW
ORLEANS
Post Hurricane Population
Estimate
New Orleans: Rental Car Tour
NEW
YORK
New York
Index
New York:
1.2 Million Residents Leave in 5 Years
New York
Employment & Commuting: 2000
New York Employment &
Commuting: 2006
Historical Densities: New York,
London, Paris, Los Angeles
Density Profile: Hong
Kong, Tokyo & New York
|
Manhattan Wards: Population
& Density: 1800-1910
New York Community Districts
Density 1970-
New York
& Boroughs: Population & Density 1790-
New York
Urban Area Population & Density from 1800
New York: Rental Car Tour
Levittown: Rental Car Tour
OKLAHOMA
CITY
Oklahoma: Poised for Growth
OSAKA-KOBE-KYOTO
Osaka-Kobe-Kyoto Index
Osaka-Kobe-Kyoto: Rental
Car Tour
Osaka Wards: Population &
Density 1990-2000
Kobe Wards: Population &
Density 1990-2000
Osaka Loop Population &
Housing
Osaka-Kobe-Kyoto Business Districts:
2001
Osaka-Kobe-Kyoto: Transport Share
House Size, Ownership
& Detached Housing 2003
PARIS
Paris
Index
Paris
Population History from 1365
Paris Urban Area Population
& Density from 1807
Paris Arrondissements:
Population From 1860
Paris Urban Area Analysis from
1921
Paris Urban
Area from 1962
Historical Densities: New York,
London, Paris, Los Angeles
Paris, Petite Couronne
& Former Seine Dept. Population
Paris:
Rental Car Tour
PEARL RIVER DELTA
Guangzhou
Index
Hong Kong
& Shenzhen Index
Shenzhen Index
Pearl River Delta
Overflight
Dongguan: Rental Car
Tour
Hong Kong Population & Density by
District
Density Profile: Hong
Kong, Tokyo & New York
Guangzhou Population &
Density District
Apple Daily Oped on Hong Kong Rail
Expansion
Dongguan: Rental Car
Tour
Guangzhou: Rental Car
Tour
Hong Kong:
Rental Car Tour
Hong Kong II: Freeways, Suburbs &
Junkyards
Macau: Rental Car Tour
Shenzhen: Rental Car Tour
PERTH
Perth Public
Transport Ridership from 1961
Central Business District: Employment
& Commuting
PHILADELPHIA
Philadelphia
Urban Area Population & Density from 1900
Philadelphia Growing Faster
than San Francisco
PHOENIX
Phoenix Land
Market Analysis
Phoenix: Not as Sprawling as You
Think
PORTLAND
(OREGON)
Portland (Oregon) Index
Smart Growth & Housing
Affordability: 8 Market Analsis
Work Trip Market Share by Work
Location
Portland: Worst Housing
Affordability Loss: 1990-2000
Portland Urban Growth Boundary
Baloons: Chartbook
Portland Metropolitan & CBD
Employment
Portland Urban Growth Boundary
Stops Growth
American Dream Boundaries:
Atlanta v. Portland
Portland's N.W. 23rd: Not a Model
Los Angeles
Double Portland Density
Travel Market Share
from Before Light Rail
Work Trip Share From Before Light
Rail
RIO DE
JANEIRO
Rio de Janeiro: Rental Car
Tour
SAN
FRANCISCO BAY AREA
Smart Growth & Housing
Affordability: 8 Market Analsis
SAN FRANCISCO BAY
AREA
Philadelphia
Growing Faster than San Francisco
San
Francisco Bay Area: Migration 2000-2004
SANTIAGO
Santiago: Rental Car Tour
SAO
PAULO
Sao Paulo
Index
Sao Paulo
Districts: Population & Density
Why Can't
Sao Paulo be Curitiba?
Sao Paulo: Rental Car
Tour
SEOUL-INCHEON
Seoul-Incheon Index
Urbanized
Land Area & Population by District
Seoul City
Population & Density by District
Incheon:
Population & Density by District
Seoul-Inchon: Rental Car Tour
SHANGHAI
Shanghai
Index
Shanghai Population &
Density District
Shanghai: Rental Car
Tour
SHENZHEN: SEE PEARL RIVER
DELTA
ST. LOUIS
St. Louis
Urban Population & Density: 1850 & 1890
St. Louis: Rental Car
Tour
STOCKHOLM
Stockholm: Urban & Suburban Population
1945-
SYDNEY
Sydney Urban Transport Market Share by
Mode
Sydney Per Capita Travel Time More than
Atlanta
Central Business District: Employment
& Commuting
TIANJIN
Tianjin
Index
Tianjin Population &
Density District
Tianjin: Rental Car Tour
TOKYO-YOKOHAMA
Tokyo-Yokohama Index
Tokyo-Yokohama: Rental Car Tour
Tokyo
Districts Population & Density
Yokohama
Districts: Population & Density
Kawasaki Districts:
Population & Density
Chiba Districts: Population
& Density
Tokyo-Yokohama Business
Districts: 2001
Tokyo Ku Area: Jobs &
Population by District
Tokyo Yamanote Loop: Jobs &
Population
House Size, Ownership
& Detached Housing 2003
Tokyo-Yokohama: Transport Share
TORONTO
Toronto
Index
Myths About
Smart Growth and the Toronto Greenbelt
Toronto:
Rental Car Tour
WASHINGTON, DC
Smart Growth & Housing
Affordability: 8 Market Analsis
WUHAN
Wuhan: Rental Car Tour
XI'AN
Xi'an: Rental Car Tour
ZURICH
Zurich:
Rental Car Tour
Zurich: Urban & Suburban Population
1930-
Zurich
Districts: Population & Density
|
THE
GREAT RECESSION
UNITED
STATES COMMUTING PROFILES: METROPOLITAN AREAS & URBAN
AREAS

Demographia Residential
Land & Regulation Cost Index
AMERICAN DREAM: LOST IN METROPOLITAN AREAS WITH URBAN CONTAINMENT POLICY
The American Dream of home ownership has
all but ended in some metropolitan regions. The Demographia Residential Land & Regulation
Cost Index shows, for example, that new house costs have
skyrocketed in San Diego and have risen strongly in Minneapolis-St.
Paul, Portland, Seattle and Washington-Baltimore. Land and
regulation costs remained at normal levels in 6 metropolitan
regions, Atlanta, Dallas-Fort Worth, Houston, Indianapolis,
Raleigh-Durham and St. Louis. MORE...
NATIONAL JOURNAL CITATION
The Public Purpose: One of
Four Top Transport Internet Sites
In
its 8 December 2001 issue, National
Journal selected The Public Purpose
as one of the top four transportation web sites. Also honored were
two US Department of Transportation sites and the site of the
Surface Transportation Policy Project. Demographia is the demographic Internet
affiliate of The Public Purpose. The Public Purpose was again named one of
the internet's best transport sites by National Journal in 2003.
 WENDELL COX IN PARIS
ASSIGNMENT WENDELL COX IN PARIS
ASSIGNMENT
Visiting Professor in Transport &
Demographics in 2002, 2003, 2004, 2005, 2006, 2007, 2008 &
2009
Wendell Cox
(principal of The Public Purpose and Demographia) served as a visiting professor
at the Conservatoire National des Arts et Metiers (CNAM) in Paris in
2002, 2003, 2004, 2005, 2006 and 2008. This French national
university has approximately 80,000 students and grants degrees to
the doctoral level. It is in the core of Paris (3rd Arrondissement)
at the Arts and Metiers Metro station and was established in the
former Abbaye de St. Martin-des-Champs during the French Revolution.
Mr. Cox has presented seminars and classes on U.S. and international
public transport, intercity rail (including Amtrak), freight
transport and world urban areas in Paris and Le Havre and conducted
research on French and European demographics and transport. He also
lectured at the University of Paris Institute of Urbanism and
Politecnico di Milano.
15th Annual Demographia International Housing Affordability Survey: 91 Major Markets, 2018: 3rd Quarter
ENDING THE HOUSING AFFORDABILITY CRISIS: TOWARD WELL FUNCTIONING CITIES
Australia . Canada . China (Hong Kong) . Ireland . New Zealand . Singapore . United Kingdom . United States
Alain Bertaud, of the New York University Marron Institute of Urban Management and former principal planner at The World Bank,
describes urban planning tendencies deterring governments from allowing sufficient housing capacity to keep housing costs affordable,
in his introduction to the 15th Annual Demographia International Housing Affordability Survey. Bertaud's new book, (
Order without Design: How Markets Shape Cities)
calls for incorporating urban economics into urban policy, the failure of which has contributed mightily to the present international housing affordability crisis.
The standard of living has been retarded and poverty increased in severely unaffordable markets. Bertaud summarizes the message of the Demographia Survey as
"unaffordable housing is not an unavoidable fatality linked to economic success." For the 9th year a row, Hong Kong is the least affordable market, with a Median Multiple of 20.9
(median house price divided by median household income), the most unaffordable in the 15 years of the Survey. Vancouver (12.6) has displaced Sydney (11.7) as the second least
affordable, followed by Melbourne (9.7), San Jose (9.4), Los Angeles (9.2) and Auckland (9.0). All of these severely unaffordable markets have developed in a local environment
of urban containment regulation (before which, "affordable" Median Multiples of 3.0 or less were typical).
Media Release
14th Annual
Demographia International Housing Affordability
Survey: 92 Major Markets, 2017: 3rd Quarter
THE HOUSING AFFORDABILITY CRISIS: A MIDDLE-INCOME STANDARD OF LIVING CRISIS
Australia . Canada . China (Hong Kong) . Ireland . Japan . New Zealand . Singapore . United Kingdom . United States
London School of Economics Professors Felipe Carazzo, Paul Cheshire and Christian Hilber provide the introduction to the 14th Annual
Demographia International Housing Affordability Survey. They note that "balanced assessment" of housing affordability requires "good measures."
They further refer to Britain as "the originator of housing unaffordability" and the ideas of planning that have
"contributed so much to the problem.
" Indeed, the failure to retain well-functioning housing markets is a problem with widespread consequences. Where housing has become severely
unaffordable, the standard of living has been retarded and poverty increased. This year's Survey shows that, for the 8th year a row,
Hong Kong is the least affordable
market, with a
Median Multiple of 19.4 (median house price divided by median household income). Sydney is (again) second worst, at 12.9, followed again by #3 Vancouver at 12.6. San Jose (10.3), which is located in the
San Francisco Bay Area has the fourth worst housing affordability and Los Angeles has the fifth worst housing affordability
among the major markets. Before urban containment regulation, nearly all markets had housing markets that were affordable (Median Multiples of 3.0 or less).
13th Annual
Demographia International Housing Affordability
Survey: 92 Major Markets, 406 Total
BEST CITIES FOR MIDDLE-INCOME HOUSEHOLDS: WHERE HOUSING IS AFFORDABLE
Australia . Canada . Hong Kong . Ireland . Japan . New Zealand . Singapore . United Kingdom . United States
Dr. Oliver Hartwich
of the New Zealand Initiative states the issue squarely in his introduction to the 13th Annual Demographia International Housing Affordability Survey:
"High house prices are not a sign of city's success but a sign of failure...," He also asserts that, without the "slightest doubt," "unaffordable
housing is almost everywhere and every time caused by the same factor: housing supply restrictions." This year's report examines
"best cities" and "livable cities" such as regularly rated by The Economist,
and others finding that more affordable cities
from the Demographia International Housing Affordability Survey have better
middle-income outcomes. Again, Hong Kong has the least affordable housing, with house prices 18.1 times households incomes. Sydney is again second
least affordable at 12.2, followed by Vancouver at 11.8, which along with Toronto (7.7) saw house prices rise equal to annual household incomes
in just one year. The 9
nation, 92 major housing market survey placed Auckland 4th at 10.0, followed by San Jose (9.6), Melbourne (9.5), Los Angeles (9.3) and San Francisco (9.2).
12th Annual
Demographia International Housing Affordability
Survey: 87 Major Markets, 367 Total
CONSENSUS BUILDING ON MIDDLE-INCOME HOUSING AFFORDABILITY CRISIS
Australia . Canada . Hong Kong . Ireland . Japan . New Zealand . Singapore . United Kingdom . United States
Senator Bob Day
of the Australian Senate calls the economic consequences of present
land use policies "devastating," in his introduction to the
12th Annual Demographia International Housing Affordability
Survey. Noting that governments and central banks have been too quick to blame unprecedented housing affordability losses
on demand factors and missed the "real culprit," the refusal of governments to
provide an adequate and affordable supply of land for new housing stock to meet demand" (typically urban containment policy).
Calling the crisis "wholly contrived" Senator Day calls it "a matter of political choice, not geographic reality",
adding, "It is the product
of restrictions imposed through planning regulation and zoning."
This year, Hong Kong has the least affordable housing
(Median Multiple of 19.0), followed by Sydney (12.2), Vancouver
(10.8), with Auckland, Mlebourne, San Jose, San Francisco,
London, Los Angeles and San Diego all exceeding Median Multiples
of 8.0. In each of these markets, housing costs relative to incomes are
triple or more their pre-urban containment levels. Many markets with liberal policies remain affordable, with Median Multiples
of 3.0 or less.
11th Annual
Demographia International Housing Affordability Survey (2014Q3)
MIDDLE-INCOME HOUSING AFFORDABILITY REQUIRES A PLENTIFUL AND AFFORDABLE LAND SUPPLY
378 Markets: Australia . Canada . China . Ireland . New Zealand . Singapore . United Kingdom . United States
Dr. Shlomo Angel of the Stern School of Business (NYU) Urban Expansion Project puts the issue simply in his
introduction: where expansion is effectively contained by draconian laws, it typically results in land supply bottlenecks
that render housing unaffordable to the great majority of residents. This is indicated in the 11th Annual
Demographia International Housing Affordability Survey, which shows the least affordable markets to be those with highly
restrictive land use regulations (typically urban containment). In Hong Kong, Vancouver, Sydney,
San Francisco, and elsewhere house prices are up to triple previous levels (income adjusted). The Demographia Survey
perspective is that first and foremost, public policy should seek a better standard of living and less poverty. Housing is the largest item in household budgets. Angel rightly notes
that housing affordability depends on plentiful and affordable land.
10th Annual
Demographia International Housing Affordability
Survey
HOUSING AFFORDABILITY AND THE STANDARD OF LIVING: RESTORING GENUINE PRIORITIES
360 Markets: Australia . Canada . China . Ireland . New Zealand . Singapore . United Kingdom . United States
Alain Bertaud, of New York University and former principal planner at The World Bank urges planners
to "abandon abstract objectives and to focus their efforts on two measurable outcomes that have always mattered
since the growth of large cities during the 19th century's industrial revolution: workers' spatial mobility and
housing affordability" in his introduction. He says that "benign sounding objectives
usually become a proxy for imposing planning regulations that severely limit the supply of buildable land and
the number of housing units built, resulting in ever higher housing prices." Noting the importance
of environmental issues, but reminds that "they should be considered a constraint to be solved not an end in itself."
The 10th
Annual Demographia International Housing Affordability Survey Survey focuses on the pivotal role of housing
affordability in achieving the universal policy priorities of higher standards
of living and poverty reduction.
9th Annual
Demographia International Housing Affordability
Survey
HOUSING
AFFORDABILITY: KEY TO ECONOMIC AND SOCIAL SUSTAINABILITY
337 Markets: Australia . Canada . China (Hong
Kong) . Ireland . New Zealand . United Kingdom . United States
Hon. Bill English, Deputy Prime
Minister of New Zealand writes in the Introduction that Land has been made
artificially scarce by regulation that locks up land for
development. This regulation has made land supply unresponsive to
demand. When demand shocks occur, as they did in the mid-2000s in
New Zealand and around the world, much of that shock translates to
higher prices rather than more
houses. This
summarizes how urban containment policies ("smart growth" or "urban
consolidation") raises house prices, reduces discretionary incomes
and impedes the quality of life (while increasing poverty). The 9th
Annual Survey chronicles the imperative for restoring housing
affordability.
8th Annual Demographia
International Housing Affordability Survey
PRESERVING THE IDEAL OF A
PROPERTY OWNING DEMOCRACY
325 Markets:
Australia . Canada . China (Hong Kong) . Ireland . New Zealand .
United Kingdom . United States
Least Affordable: Hong Kong, Australia, New
Zealand, UK, Hong Kong, Vancouver, Sydney
Prof. Robert
Bruegmann notes that Residential real estate plays a huge and
increasingly important role in the economy of every nation.
He continues that a
growing number of people who have looked at the figures have tended
to agree that a good many well-meaning policies involving housing
may be pushing up prices to such an extent that the negative
side-effects are are more harmful than the problems the policies
were intended to correct. This 8th edition shows
improvements in many markets, but some, like Hong Kong, Vancouver
and Sydney continue to be exhorbitantly expensive. The association
between higher house prices and more restrictive land use regulation
is clear, as is the conclusion that urban
consolidation or smart growth is incompatible with affordable
housing.
7th Annual
Demographia International Housing Affordability Survey
HOW OVERLY RESTRICTIVE
LAND-USE POLICIES DENY HOME OWNERSHIP
325 Markets: Australia .
Canada . Ireland . New Zealand . United Kingdom . United States .
China (Hong Kong)
Renown
author Joel Kotkin notes that even after
the bursting of the housing bubble implosion, house prices have
risen well above incomes, in his introduction to the 7th edition.
Kotkin cites markets such as Los Angeles, San Francisco, and New
York, adding that: perhaps most remarkable has been the shift in
Australia, once the exemplar of modestly priced, high quality middle
class housing, to now the most unaffordable housing
market... He disputes "progressives" who wrongly claim that
dense urbanism is the preference of the next generation...
He says this promotes a form of neo-feudalism which reverses the great
social achievement of dispersing property ownership. Kotkin
concludes that: The
ideal ... should not ... be affordability alone but affordability
coupled with economic growth and that broad based middle class
prosperity depends in large part on housing affordability, and may
do even more so in the future.
Media Release . Research Summary: Smart Growth
& Housing Costs
6th Annual
Demographia International Housing Affordability Survey
PLAN-DRIVEN LAND USE
REGULATION: MAKING HOUSING UNAFFORDABILITY PUBLIC
POLICY
272 Markets in Australia .
Canada . Ireland . New Zealand . United Kingdom . United States
Dr. Tony Recsei,
President of Save Our Suburbs (SOS) in Sydney writes home ownership has been a
source of boundless opportunity in his introduction to the
6th Edition. He says that urban planning policies
are poised to reduce home ownership to nothing more "but a
dream as vast
numbers of young people and the underprivileged will never be able
to raise a family within the security of their own home. Dr.
Recsei systematically rebuts the notion that sustainability requires
densification and concludes Unless we are vigilant, high-density zealots
will do their best to reverse centuries of gains and drive us back
towards a Dickensian gloom. This year's edition highlights
the continuing deterioration of housing affordability in Australia
and improvements in the United States, where values driven up in the
housing bubble in some markets have returned to near the historic
norms. Further, the Survey describes the
process by which plan-driven land use regulation (growth management,
urban consolidation, compact city policy or smart growth) makes land
for housing development unaffordable and as a result places housing
affordability beyond reach.
Media Release . SOS Media Release
5th Annual
Demographia International Housing Affordability Survey
THE UNACCEPTABLY HIGH
HUMAN COSTS OF SMART GROWTH & URBAN
CONSOLIDATION
265 Markets in Australia . Canada . Ireland .
New Zealand . United Kingdom . United States
Dr.
Shlomo Angel, of Princeton University and New York University,
one of the world's leading experts in urban planning writes in the
preface to this 5th Annual Demographia
International Housing Affordability Survey< that ...the current efforts to
contain the pace of the outward expansion of cities for one reason
or another are, at the very least, open to serious question.
Referring to land use regulation, he continues: The more stringent the
restrictions, the less is the housing market able to respond to
increased demand, and the more likely house prices are to increase.
And when residential land is very difficult to come by, housing
becomes unaffordable., This report describes the economic
connection between that "smart growth"/"urban consoldiation"
policies (prescriptive land use policies) and the unprecedented
house price escalation that has occured in recent years in some
markets. Moreover, the consequences have expanded well beyond
housing. Without prescriptive land use regulation, the housing
bubble in the United States would have been less severe; without a
severe housing bubble, the US mortgage meltdown would not have
occurred and without the US mortgage meltdown, the international
financial crisis might not have occurred. It will be important to
reform land use policies to prevent similar damage from occuring in
the future. - -
SMART GROWTH ASSOCIATED
WITH RADICALLY HIGHER HOUSING COSTS IN THE UNITED
STATES
Costs of Sprawl
Forecast Misses by a Mile
It has been claimed that smart
growth would reduce housing costs. A $13,000 (2007$) decline in new
residential unit costs was predicted for 2000 to 2025 in Costs of Sprawl --- 2000, for markets with
smart growth (prescriptive planning) compared to responsive planning
systems. At this rate, a reduction of nearly $4,000 would have
occurred between 2000 and 2007. The reality was starkly different.
In just seven years, median house prices rose more than $160,000 in
prescriptive planning areas relative to prices in markets with
responsive planning.
 PENNSYLVANIA'S
EFFICIENT TOWNSHIP GOVERNMENT PENNSYLVANIA'S
EFFICIENT TOWNSHIP GOVERNMENT
Study Shows Smaller
Governments Have Far Lower Costs per Capita
In
this report commissioned by the Pennsylvania State Association of
Township Supervisors, Demographia shows that the Commonwealth's
smaller local governments have by far the lowest costs per capita,
even when attributable spending is added and spending financed by
state and federal sources is subtracted. This conclusion is in
opposition to the "conventional wisdom," which is that larger
governments are more efficient. In fact, the only "economies of
scale" in larger governments are for special interest, which are
able to exert control over larger government organizations with less
effort and expenditure than would be necessary to control a myriad
of smaller local governments. At the same time, smaller local
governments are more effective because they are "closer to the
people."
 NEW YORK'S
EFFICIENT TOWN GOVERNMENT NEW YORK'S
EFFICIENT TOWN GOVERNMENT
Study Shows Smaller
Governments Have Far Lower Costs per Capita
In
this report commissioned by the Association of Towns Of New York,
Demographia shows that the Commonwealth's smaller local governments
have by far the lowest costs per capita, even when attributable
spending is added and spending financed by state and federal sources
is subtracted. This conclusion is in opposition to the "conventional
wisdom," which is that larger governments are more efficient. In
fact, the only "economies of scale" in larger governments are for
special interest, which are able to exert control over larger
government organizations with less effort and expenditure than would
be necessary to control a myriad of smaller local governments. At
the same time, smaller local governments are more effective because
they are "closer to the people."
THE HEAVY PRICE OF SMART
GROWTH AND URBAN CONSOLIDATION
4th
Annual Demographia International Housing Affordability
Survey
Former
Reserve Bank of New Zealand Governor Donald Brash writes in the
introduction to this 4th Annual Demographia
International Housing Affordability Survey that "the
affordability of housing is overwhelmingly a function of just one
thing, the extent to which governments place artificial restrictions
on the supply of residential land." This report describes the
economic consensus that "smart growth"/"urban consoldiation" have
destoyed housing affordability in many urban areas. The scarcity
produced by smart growth and urban consolidation markets has serious
social and economic consequences. The resulting asset bubble has
interfered with economic policies of central banks, as in the US and
New Zealand. Yet, in responsive markets, housing affordabilty
remains robust, including the three fastest growing large markets in
the high income world, Atlanta, Houston and
Dallas-Fort Worth and in other Canadian (such as Ottawa) & US markets.
SMART GROWTH & URBAN
CONSOLIDATION: INCOMPATIBLE WITH HOUSING AFFORDABILITY
3rd Annual
Demographia International Housing Affordability Survey
The unprecedented housing
affordability crisis is worst in
Australia, where years more income are now required to buy a
home than just 10 years ago. Ireland, New Zealand and the United
Kingdom have also become seriously unaffordable. Some markets in the
United States and Canada are also severely unaffordable, especially
on the Pacific Coast and in Northeast. Strong affordability continues in many
markets, such as Atlanta, Dallas-Fort Worth, Houston, Winnipeg,
Ottawa, Quebec, Indianapolis Cincinnati and Kansas City. This
edition includes a comparison of Perth,,
Australia and Austin, Texas, similarly
fast growing markets, but where the differences in housing
affordability are like "night and day." The distinguishing feature
is regulation --- smart growth and urban consolidation are associated with
severe housing affordability losses.
HOUSING AFFORDABILITY
CRISIS: CAUSE NOT MICROECONOMICS
2nd Annual Demographia
International Housing Affordability Survey
Some economic analysts have
attempted to blame the housing affordability crisis on demand or low
interest rates. The reality, however, is that some of the most
affordable housing markets (examples are Atlanta, Dallas-Fort Worth
and Houston) also have the highest demand. The same low interest
rates have been available both in the unaffordable and the
affordable markets and cannot therefore be the cause of the housing
affordability crisis. This Second Annual
Demographia Housing Affordability Survey provdes a detailed
examination of the issues behind the present structural and spotty
housing affordability crisis.
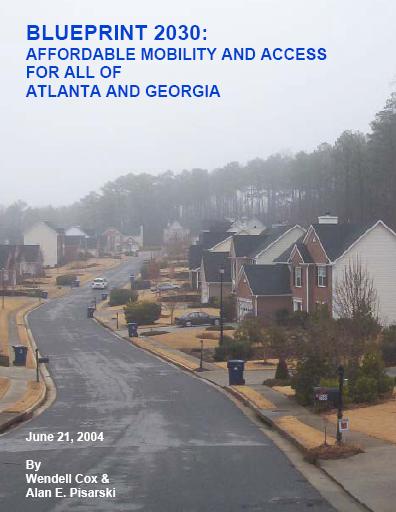 BLUEPRINT
2030: MOBILITY AND ACCESS FOR ATLANTA BLUEPRINT
2030: MOBILITY AND ACCESS FOR ATLANTA
Traffic Congestion Can be
Reduced: The First Step is to Try
In this
report, Wendell Cox and Alan Pisarski show that Atlanta's intense
traffic congestion, unusual for a low density urban area, is
principally the cause of underinvestment in suburban roadways.
Rejecting, the "maternity wards increase the birthrate" logic of " d
demand," they show how the Atlanta area can improve its traffic
flow, saving people time and improving economic efficiency. While
the casual visitor to Atlanta may think the urban area well served
by wide freeways, coverage of the urban area is sparse. In fact,
Atlanta has the greatest extent of suburbanization in the world
unserved by cross-town (lateral) freeways. Further, the area has a
substandard arterial (non-freeway) road system. Nonetheless,
significant improvements can be made with expenditures that are well
within the capability of the local economy. Atlanta's continued
growth could well depend upon it.
AMERICAN DREAM
THREATENED: BLACKS, HISPANICS AT GREATEST RISK
Growing Smart: Planners Would Confiscate
Homes Not Consistent with Their Plans
The
American Plannning Association has developed a legislative guidebook
containing model legislation which, if enacted would increase the
price of housing, with the impact falling most heavily on lower
income households, which are disproportionately African-American or
Hispanic. Other provisions could force confiscation of houses where
subsequent zoning changes render a use non-conforming. The model
legislation is based upon the planning doctrine of smart growth,
which like a previous planning doctrine, urban renewal, will make
urban areas less attractive places to live.
SMART GROWTH: DELUSION,
NOT VISION
Wendell Cox
Closing Statement at Railvolution
Conference
On December 1, Wendell Cox and Congressman Earl
Blumenauer (D-Oregon) debated smart growth and transit at the annual
Railvolution conference in San Francisco. Wendell Cox's closing
statement is reproduced here.
BADGE OF
HONOR
Wendell Cox
Placed on Sprawlwatch
List
Wendell Cox and others are highlighted as
opponents of the anti-sprawl movement. Cox stated that placement on
the list was a "badge of honor." but that Sprawlwatch would have more correctly
characterized those on the list as "pro-choice" with respect to
urban development --- that people should have the freedom to live
and work where they like.
WENDELL COX OPED IN THE
ATLANTA CONSTITUTION
Portland Not
Sprawl Free: Atlanta Needs Other Policies
Despite Atlanta's reputation for severe traffic
congestion and low densities, Wendell Cox shows that the Atlanta
area scores generally better on measures of transit use than
Portland, which has gained an international reputation for policies
intended to increase transit ridership and urban density. His
conclusion is that Portland's policies would not solve Atlanta's
traffic problems any more than they have Portland's.
WENDELL COX OPED IN THE
WASHINGTON TIMES
A Straitjacket
on Growth
New urbanist and
so-called "smart growth" policies promise to slow economic growth
where implemented and could limit job creation and business
expansion. Limitations on new "big-box" retailers is likely to limit
job growth in construction trades and related industries. The
telecommunications revolution and the expansion of regional jet
service could erode the competitiveness of larger metropolitan
areas, in combination with new urbanist and so-called "smart growth"
initiatives. Smaller metropolitan areas are likely to benefit, as
they welcome the growth turned away by metropolitan areas like
Portland, Oregon.
RESPONSE TO REPORT BY
DAVID RUSK
Keeping
Kalamazoo Competitive: The Husock Report
This report by Howard Husock of the John F.
Kennedy School of Government at Harvard University and Wendell Cox
challenges the findings of the Kalamazoo
County Compact by David Rusk and recommends competition based
measures to improve the competitiveness of Kalamazoo.
|


